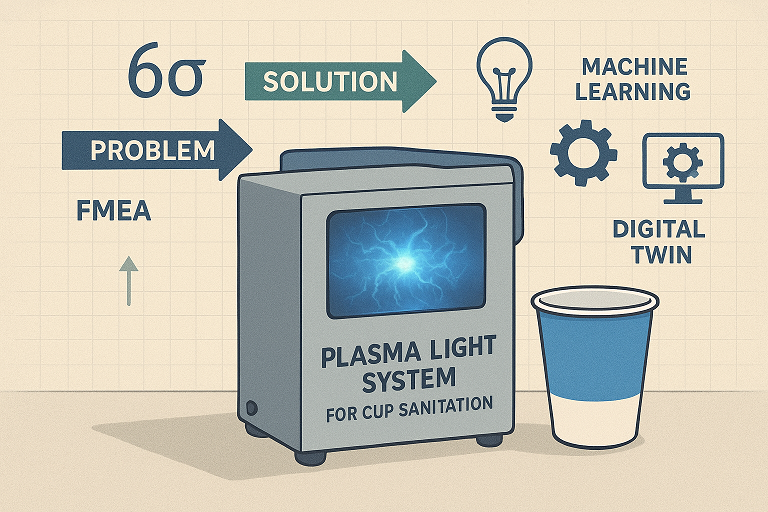
Optimisation of Plasma Light Sanitation Technology
Turn problem into service revenue opportunity [7 min read]
Story of the CleanTech technology introduction
This case study [7min read] aimed to illustrate how problem solving project could turn, almost failed technology experiment, into a great technology with the opportunity to setup a service business
The aim of this study is not to describe technological details but rather show how powerful could be a combination of:
- Engineering Knowledge & entrepreneur mindset
- Lean and 6 Sigma Methodology
- Computer and Data Science
This article will use illustrations generated from data, AI generated images and code
Disclaimer
For technical illustration only! Key technical details, names, data labels may be omitted to preserve confidential data and key know-how. Only generally synthetic data, open-source tools and methods will be used. Detailed root-cause analysis was conducted but will not be illustrated.
Situation
Executive Summary
This case study is about the novel equipment installed in the factory, how L6S methodology was used to run an improvement project, how the team was built to understand the problem, prioritize critical concerning point, define experiment to study impact of contributing factors, model such relationship, build a digital twin of the process, measure value - added of the achieved results.
CleanTech technology
Sustainability is a clear trend often generating step-change technology introduction. Yes, it can be both:
- Functional
- Sustainable (CO2 neutral, no water, no chemical)
- Cheaper
- Safer
As such, use of this technology is growing bringing new use-cases applicable for packaging sanitation purposes
Customer Voice
However, after few years of usage, the situation was not fully great. Although the key function and safety requirements were definitely good, the following short-comings were reported:
- Equipment was overheating
- Multiple stoppages and sudden failures
- High usage of spare parts
- Some spare parts were worn out earlier than prescribed
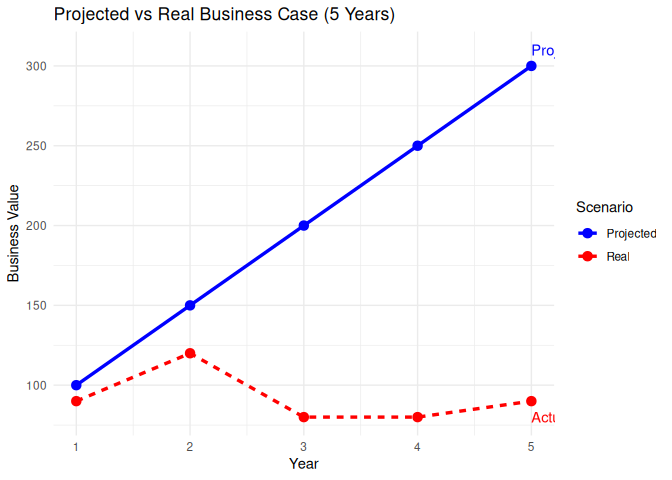
In summary, initially defined Business Case did not materialise itself
Task
Prior to this project, author had no specific technical knowledge whatsoever on this technology. Nevertheless, thanks to the available data and factory reports, it was possible to study and understand rather complex matters.
Understanding of technology
Key knowledge was captured through:
- Relevant Patents from the Technological Field
- Technical Documentation from the equipment vendor
- Earlier available technical report
- Requested feedback from the using factory
- Crash course from supplier
- Generally available knowledge on the internet, Google search, Copilot
FMEA or Failure Mode and Effect Analysis
Critical step in any problem solving activity is to be able to prioritize. A good tool to achieve that is the FMEA process, part of 6Sigma methodology.
Example FMEA Table (Pulsed Light Technology)
| Process Step | Failure Mode | Effect on Process/Product | Severity (1–10) | Occurrence (1–10) | Detection (1–10) | RPN | Recommended Action |
|---|---|---|---|---|---|---|---|
| Lamp pulse generation | Pulse intensity too low | Insufficient microbial inactivation | 8 | 4 | 5 | 160 | Calibrate lamp, monitor output |
| Conveyor system | Product misalignment | Uneven exposure, reduced efficacy | 6 | 3 | 6 | 108 | Add alignment sensors, adjust guides |
| Control software | Timing error in pulse trigger | Over/under exposure of product | 7 | 2 | 4 | 56 | Implement redundancy, software check |
Top priority - condensation on the cooling surfaces
One of the causes of poor performance was condensation on the cooling surfaces. For this, the Magnus formula for automatic dew point calculation could be suggested.
This can be done using a humidity sensor and a function:
# Magnus formula for dew point
dew_point <- function(temp, rh) {
  a <- 17.27; b <- 237.7
  alpha <- ((a * temp) / (b + temp)) + log(rh/100)
  dp <- (b * alpha) / (a - alpha)
  return(dp)
}
For example, risk of condensation could then be visualized:
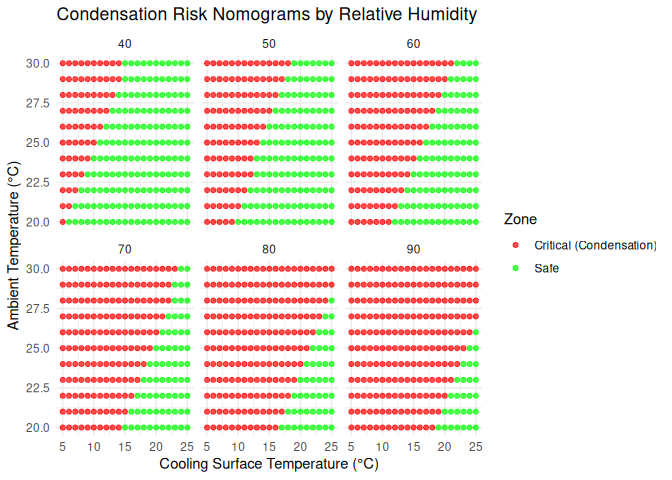
That risk could be directly controlled and mitigated through the PLC code. In this case, we are adding dry compressed air into the system once relevant:
Example ST PLC Code (Humidity Control)
FUNCTION_BLOCK FB_HumidityControl
VAR_INPUT
    Humidity       : REAL;   // %RH
    CoolingTemp    : REAL;   // °C
    AmbientTemp    : REAL;   // °C
END_VAR

VAR_OUTPUT
    BlowAir        : BOOL;   // Output to activate compressed air
END_VAR

VAR
    DewPoint       : REAL;
END_VAR

// Simple Magnus formula approximation for dew point
DewPoint := (237.7 * ((17.27 * AmbientTemp) / (237.7 + AmbientTemp) + LN(Humidity/100))) /
            (17.27 - ((17.27 * AmbientTemp) / (237.7 + AmbientTemp) + LN(Humidity/100)));

// Control logic: if cooling surface < dew point, risk of condensation
IF CoolingTemp < DewPoint THEN
    BlowAir := TRUE;   // Activate compressed air to reduce humidity
ELSE
    BlowAir := FALSE;  // Safe zone, no action
END_IF;

END_FUNCTION_BLOCK
Top priority - Pulse intensity is too low
Key risk was identified is the effect of solarization which means that generated plasma will slowly degrade quartz glass and cause lower sterilization effect.
Optimization task
Equipment shall be optimized to work in the safe boundary:
- High limit of energy: limits degradation of parts
- Minimum limit of energy: sufficient for safe microbial deactivation
Such risk was further handled using proposed and illustrated below Design of Experiment
DoE or Design of Experiment
To find optimized operational conditions, team defined following trial setup
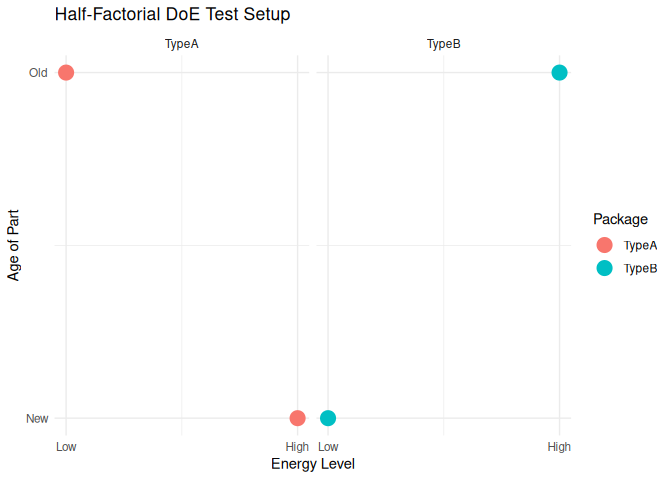
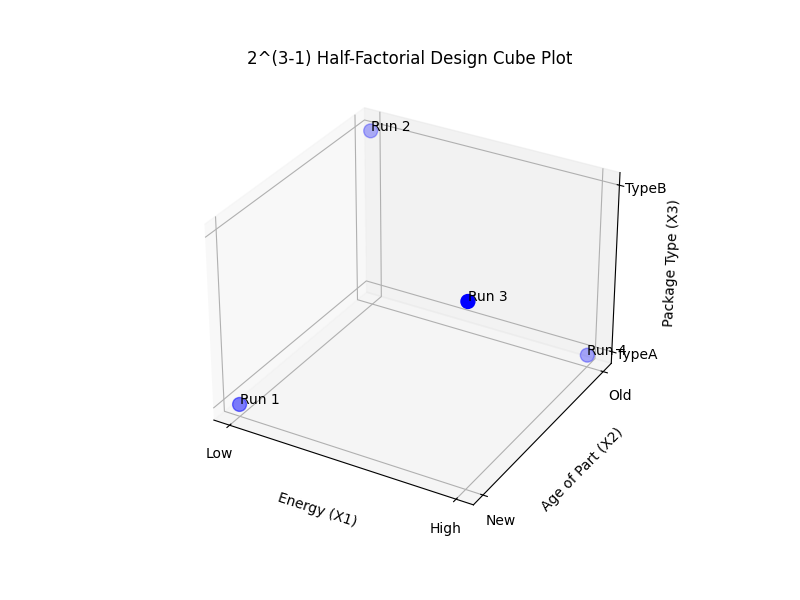
Visual Test Setup for DoE (Plasma Sanitation)
- Design matrix → generated with R package
FrF2. - Cube-style plot → shows the 4 experimental runs as points in factor space.
- Facets → separate panels for Package Type (TypeA vs. TypeB).
- Axes → Energy (Low/High) vs. Age (New/Old).
Obtained data
Obtained data (property of the vendor) will not be used for this demonstration. Nevertheless, we will further generate some synthetic data aiming to describe similar output
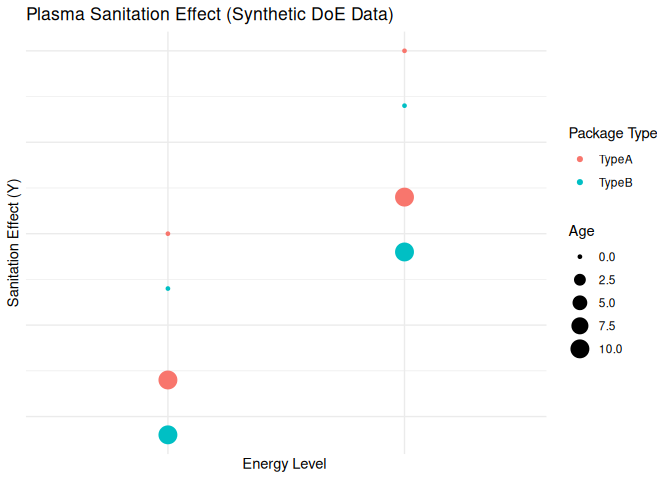
Example Output (Synthetic data)
| Age | Energy | Package | SanitationEffect |
|---|---|---|---|
| 0 | 25000 | TypeA | 30.5 |
| 0 | 25000 | TypeB | 30.2 |
| 0 | 30000 | TypeA | 40.5 |
| 0 | 30000 | TypeB | 40.2 |
| 10 | 25000 | TypeA | 20.7 |
| 10 | 25000 | TypeB | 20.4 |
| 10 | 30000 | TypeA | 30.7 |
| 10 | 30000 | TypeB | 30.4 |
This dataset is synthetic but consistent with the following logic:
- Energy ↑ → sanitation effect ↑
- Age ↑ → sanitation effect ↓
-
TypeB → slightly lower than TypeA
## Ignoring unknown labels: ## • shape : “Age of Part”
Modeling
After initial consideration, few more trials have been made adding increased energy point. This helped to better understand the system.
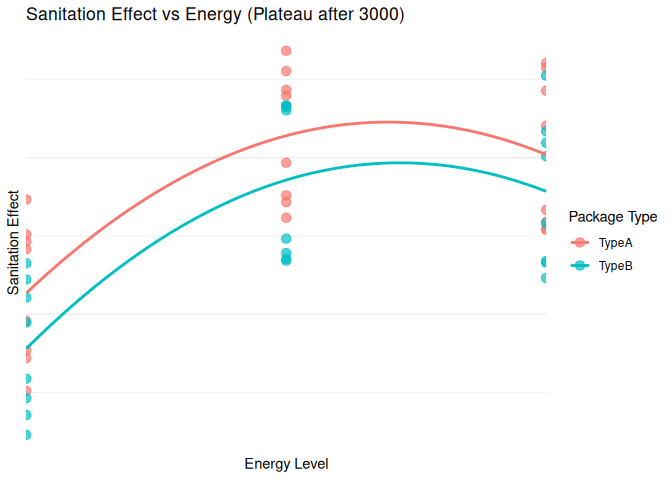
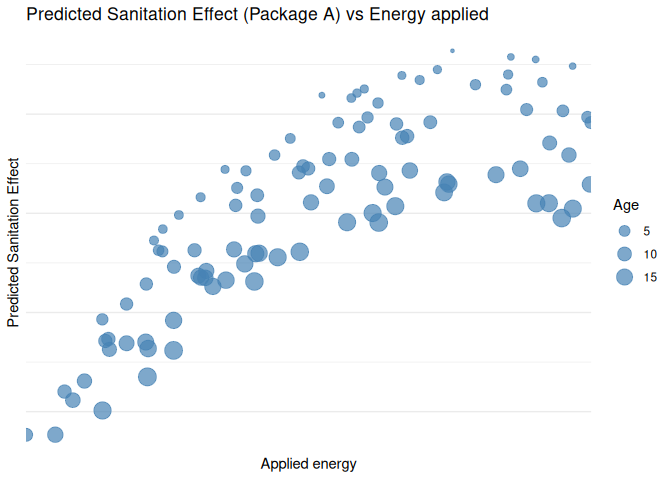
Random Data Generation and Model Prediction
Graph below shows the model prediction on synthetic dataset (including with that of un-seen data):
Achievement
Resulting improvement and optimization work was focused on two key areas of concern:
- avoids risk of condensation keeping highest efficiency
- operate system with optimal parameters keeping safe performance at lowest possible energy and costs
Digital Twin
As the obtained data were gathered from the equipment itself, we can use it to develop a Digital Twin. Two goals could be reached:
Advanced Process Control
By implementing obtained model in PLC [model coefficients] it will be possible to automatically maintain the system in the most efficient region of operation. For instance, machine can dose the energy up to desired level considering both aging of parts, type of packaging and of course, desired sanitation effect. Secondary effect expected should be much slower parts degradation.
Design future equipment
Obtained data can be also used to estimate technology capability for the unknown scenarios For instance, estimate size of equipment for highest capacities
Value added services
Obtained data and model can also enable value added services. For instance, it shall be possible to access Asset Health by estimating remaining useful parts time.
Teamwork
It was once again very symbolic that using proper method can help to bring clarity into the team work. Everyone from engineering to quality could understand the process, meaningfully contribute to the team and be recognized for the achieved results.
Economic effect
Effect of solved problem can be qualitatively described below:
- Increased reliability and consequently equipment availability
- Greater control over the product quality
- Achieving CO2 neutral operation at better cost of ownership
Potential Larger scale benefit
This work helped to put back on track CleanTech technology experimental introduction. It can lead to the following scale up benefits:
- Obtained know-how and best practices to introduce this technology in other factories
- More efficient equipment use, lower operational costs can be leveraged to define service business opportunities. For example, in case such system is installed on 500 machines and the yearly license is 2025CHF, then the yearly service revenue can be: 1’013’000 CHF.
Result
The key learning of this use case is not only in the fact that performed work helped to ‘save face of technology’, but in the method. In fact, in the above examples we can observe different Data Science methods applied to the engineering problem.
The key to success was in a powerful combination: Engineering Curiosity, Data Science, Teamwork